Q4 Downtime: The Repair Bill Is Only Part of the Cost

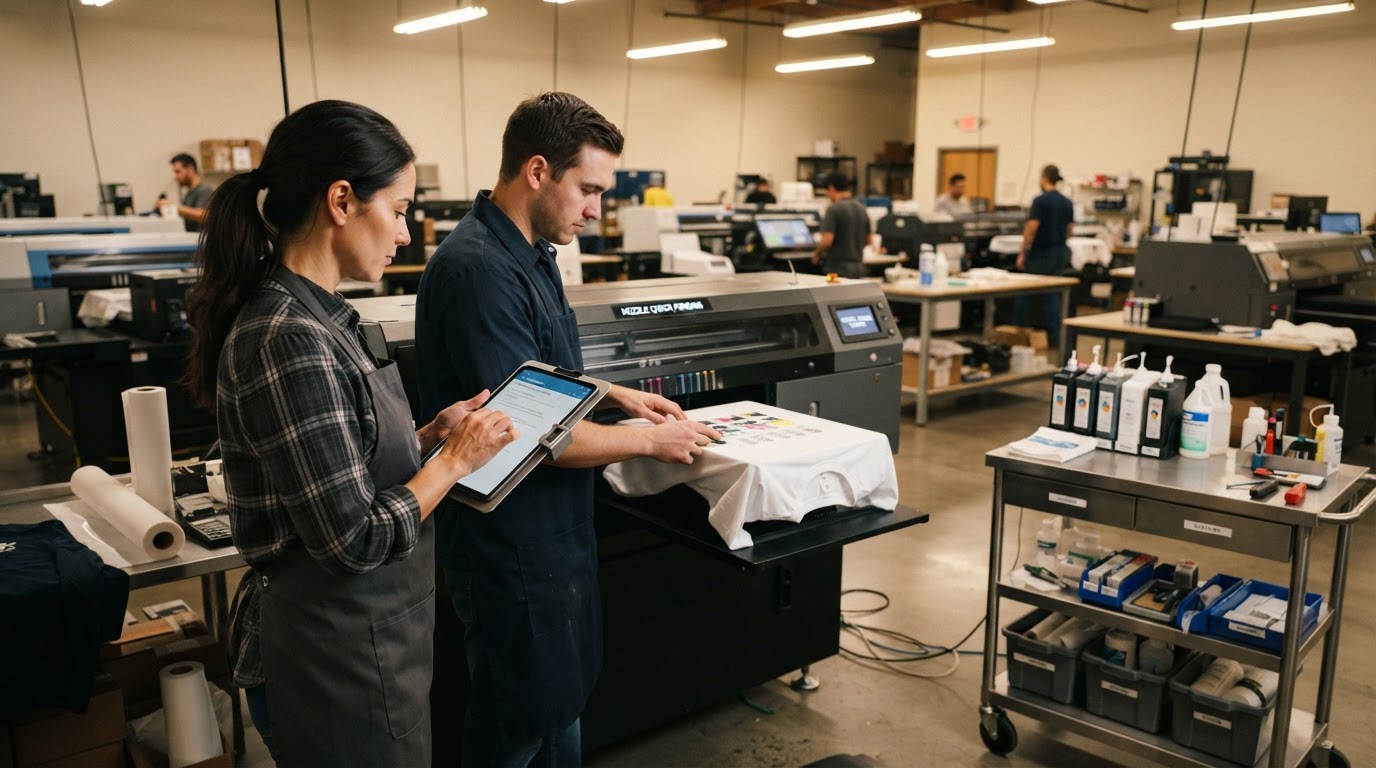
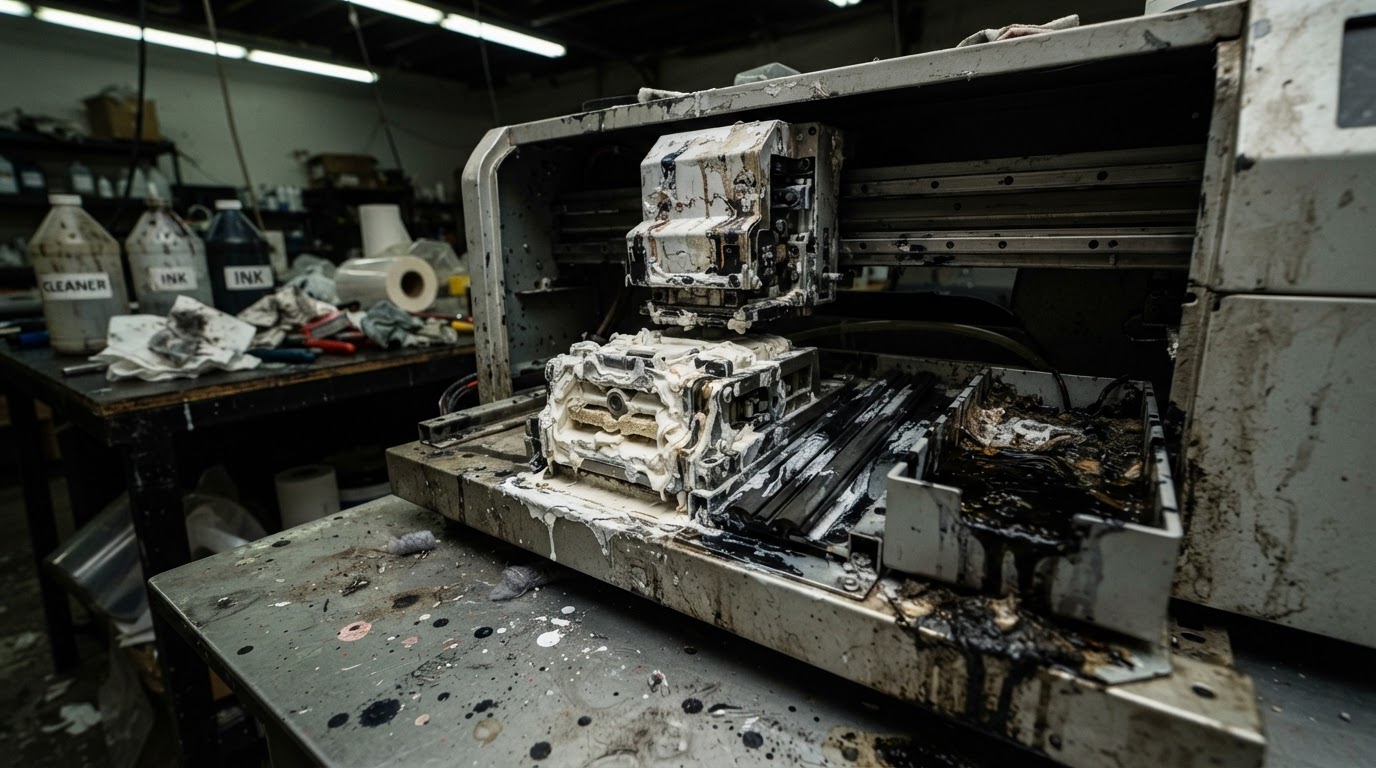
Consider an illustrative scenario: It is 10:30 AM on a Tuesday in mid-November. Your production schedule is committed through Friday evening, with 1,800 custom-decorated hoodies scheduled across two shift windows. A primary DTF or DTG engine drops white channels mid-run. The technician quotes $1,400 for a replacement printhead and damper assembly, with arrival scheduled for tomorrow afternoon. To an owner reviewing line items, $1,400 sounds like the size of the event. To a plant manager responsible for delivery windows, the invoice is only the down payment on the true cost of the outage. The scenario above is illustrative for clarity, not a documented customer incident.
In peak season, your Q4 production schedule has one major assumption built into it—that the equipment will keep running. But Q4 does not wait for printer repairs. When machine capacity drops hour after hour, the cost ripples downstream through pressing, finishing, packing, and dispatch long before the repair technician steps onto the floor.
The invoice for a printhead or damper assembly represents the cost of fixing hardware. It does not measure the cost of displaced capacity, overtime catch-up, or expedited freight required to meet a hard shipment deadline.
Grounding the numbers: Empirical evidence on maintenance and downtime
To talk about downtime responsibly, separate what cross-industry research shows from what a DTF or DTG shop actually measures in its own ledger. Two sources are worth citing here, and both describe the manufacturing sector at large—not garment decoration specifically.
The first is the 2026 Limble State of Maintenance report, a vendor-published survey of 686 U.S. maintenance and operations professionals surveyed July 29–August 6, 2026. The report is not a DTF/DTG industry study; it is cross-industry, and the 686 figure is the total survey sample, not necessarily the number of leaders who answered each individual leadership question. Within that survey, 47% of responding leaders reported more than 10 hours of unplanned downtime in a typical month, and 40% estimated annual downtime costs of $100,000 or more.
The second is a 2021 study from the National Institute of Standards and Technology (NIST), Maintenance Costs and Advanced Maintenance Techniques for Manufacturing Machinery. It compared U.S. machinery manufacturers grouped by how heavily they relied on reactive (run-to-failure) maintenance versus more preventive or predictive approaches. In the 2021 NIST study, the group relying less heavily on reactive maintenance had 52.7% less unplanned downtime than the more reactive group—an observational manufacturing comparison, not DTF-specific evidence, proof of causation, or a WhiteGuard performance result.
Both sources are cross-industry. Neither measures DTF or DTG equipment, and neither establishes that a specific tool or routine will produce a guaranteed result in any individual shop.
Evidence summary: maintenance research and management relevance
| Finding | Source / year | Scope | Management relevance |
|---|---|---|---|
| 47% of leaders reported more than 10 hours of unplanned downtime in a typical month. | Limble State of Maintenance | 686 U.S. maintenance & ops professionals; survey publisher: Limble (2026) | Unplanned downtime is a recurring operational baseline in many facilities, not an exception. |
| 40% estimated annual downtime costs of $100,000 or more. | Limble State of Maintenance | Same survey; self-reported estimates across diverse facility types (2026) | The financial weight of idle hardware extends well beyond the cost of replacement parts. |
| In the 2021 NIST study, the group relying less heavily on reactive maintenance had 52.7% less unplanned downtime than the more reactive group. | NIST manufacturing study | U.S. machinery manufacturers; observational comparison (2021) | An association, not proof of causation or a guaranteed outcome from any single tool or routine. |
Cross-industry findings, not DTG/DTF-specific evidence. Survey sizes refer to total respondents; individual leadership questions may have fewer answers. Estimates are self-reported.
The three layers of an unplanned outage: repair, output, and recovery
To evaluate an outage accurately, production management must distinguish three different categories of impact:
- Direct repair expense — the hard cost of replacement parts (printheads, capping stations, pumps) and third-party service technician fees.
- Disrupted output — the volume of decorated goods that did not move through the printing bottleneck during the machine's idle hours.
- Recovery expense — the incremental dollars spent to make up that lost output: overtime, premium freight, scrap re-prints, or sub-contracting fees.
Separate permanently lost business from work completed later. An incident may create both recovery expenses and lost contribution from orders you cannot fulfill. Record each distinct impact once. Do not count the same order as both a permanently lost sale and recovered production, or add lost revenue and lost contribution as separate losses.
Downstream workflow propagation: how a print stop reaches finishing
In DTF and DTG workflows, printing is the pacing bottleneck. When the printer goes down, downstream operators at heat presses, trim tables, quality audit, and bagging stations do not immediately bank labor savings; they frequently stall waiting for work to arrive.
But keep machine-hours separate from labor-hours. You cannot multiply a single bottleneck rate loss across every downstream department's hourly rate at once. Downstream teams can be reassigned to prep, staging, or secondary jobs. The labor cost that actually materializes is the premium overtime those teams work later, processing the compressed wave of printed transfers once the engine recovers.
A practical numerical recovery model
To see how time compresses during a Q4 outage, work through this hypothetical, clearly labeled example. The numbers are illustrative assumptions, not measured shop data.
- Baseline: A DTF printing line sustains a bottleneck pace of 60 accepted DTF transfers per hour.
- Interruption: A two-hour head clog and recovery stoppage occurs. Displaced output = 60 transfers/hour × 2 hours = 120 displaced accepted DTF transfers.
- Recovery window: 4 operating hours remain in the active shift to complete the day's scheduled order.
- Required recovery pace: The remaining planned output (240 transfers) plus the 120 displaced transfers must be produced across those 4 hours: (240 + 120) ÷ 4 = 90 accepted DTF transfers per hour.
- What it means: 90 transfers/hour is a 50% increase over the original 60 transfers/hour baseline. That is the required recovery pace—it does not establish that the machine, the heat-press operators, or the downstream workflow can actually sustain a 50% rate increase.
Q4 outage cost worksheet for production managers
Use this simple worksheet when evaluating an equipment breakdown. Different recovery strategies incur different line-item costs—and not every line applies in every scenario.
- Line 1 — Direct parts & technician service (e.g., replacement printhead, dampers, service call-out fee). Applies in any physical hardware failure.
- Line 2 — Incremental recovery labor (e.g., operator overtime hours to clear the backlog). Applies when catching up in-house.
- Line 3 — Spoilage & re-print materials (e.g., garments ruined by initial head strikes, or test swatches burned during diagnosis). Applies during diagnostic and test phases.
- Line 4 — Outsourcing / wholesale transfer premiums (e.g., ordering emergency DTF transfers from a trade supplier to hold the deadline). Applies only if in-house capacity cannot catch up.
- Line 5 — Expedited logistics (e.g., upgrading UPS Ground to Next-Day Air to meet a carrier cutoff). Applies only when production completion slips against the ship date.
Five practical management measures for print supervisors
Rather than chase vague targets or unproven claims, track five straightforward shop metrics. There is no universal number to hit—set targets against your own demand and capacity.
- 1. Unplanned downtime minutes — total minutes production lines are stopped for unscheduled maintenance or head recovery.
- 2. Accepted output per operating hour — net first-quality decorated garments produced, divided by active printer run hours.
- 3. Maintenance completed when due — share of scheduled daily white-ink agitations, cap wipes, and environment checks actually completed on time.
- 4. Rework / scrap rate — spoiled garments divided by a defined denominator (e.g., total blank garments loaded).
- 5. On-time completion / shipment rate — share of committed customer orders handed to the carrier on or before the scheduled ship date.
Building the daily habit
A practical maintenance routine can help teams identify and document developing issues before they become larger production problems. It does not prevent every failure, and no routine is a guarantee of uptime. Two earlier field notes connect directly to the work above: one breaks down what a skipped week of maintenance actually costs a shop, and the other traces the recurring ownership cost of white ink that most buyers only meet after the quote.
WhiteGuard™ LITE is a free web app designed to support that daily discipline. It gives operators a simple four-check daily routine—agitation, nozzle verification, capping seal inspection, and environmental logging—alongside reference operating procedures kept on the device. It does not predict downtime, diagnose failures remotely, or guarantee equipment protection; it makes daily white-ink care visible, structured, and consistent so the routine has a record behind it.
Build your daily maintenance streak
Use WhiteGuard™ LITE to structure daily white-ink checks and keep reference operating procedures at your fingertips.
Get buyer-first guidance in your inbox
New field notes on DTF, DTG & UV ownership — no hype, no rankings.